Economic activity
Auckland's GDP
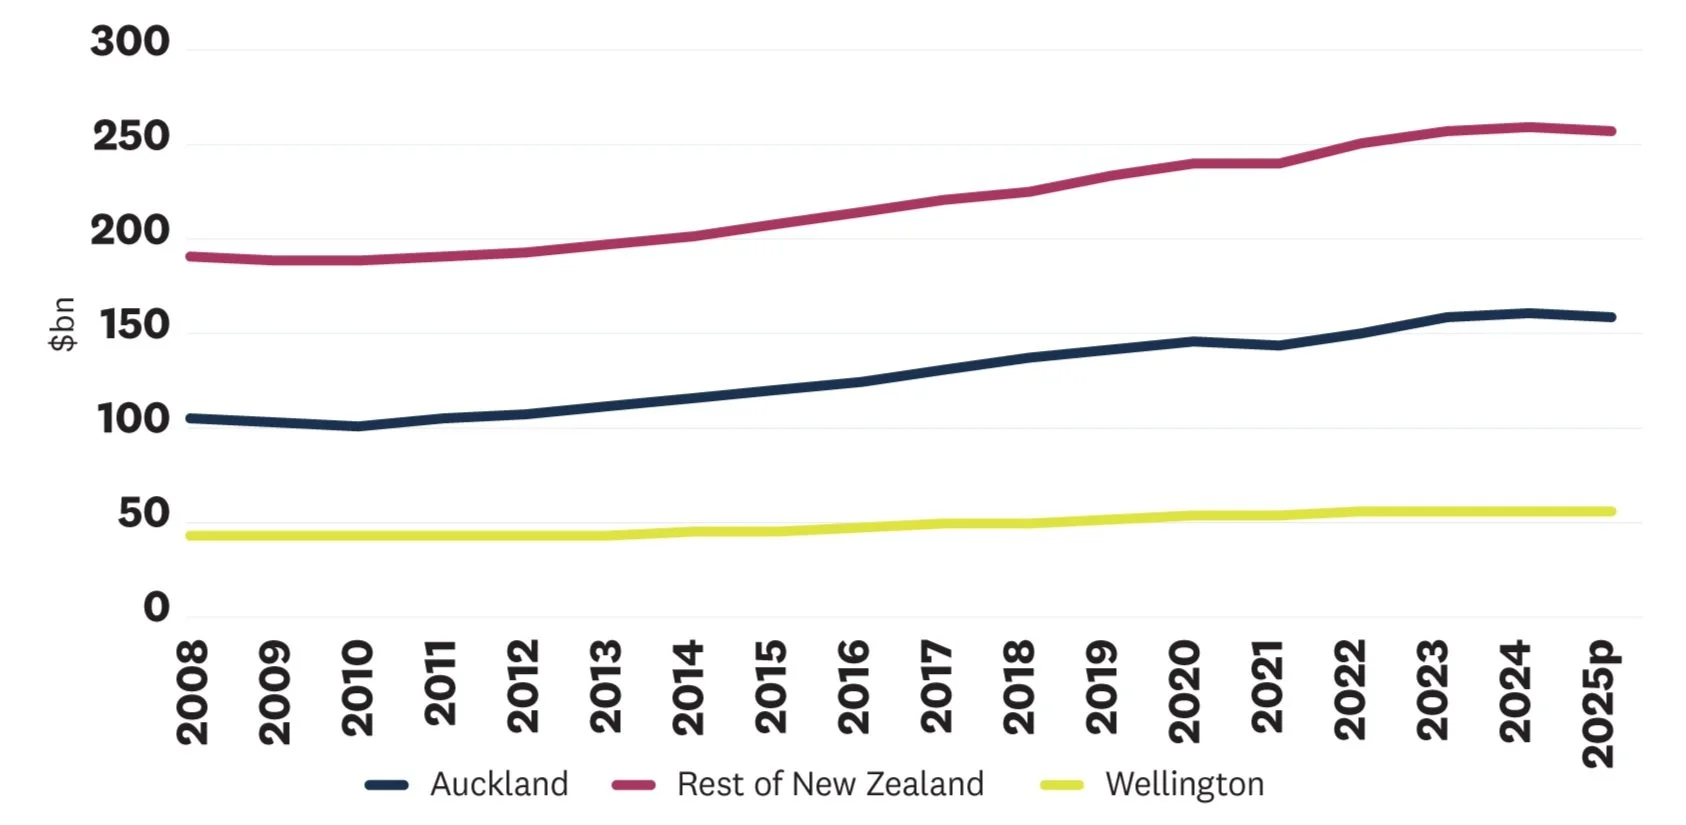
GDP (March year, 2024 Prices, $bn)
Real GDP growth rate (March year)

While Tāmaki Makaurau Auckland’s economy continued to grow in the year to March 2024, provisional estimates show a slight decline in economic output over the last 12 months.
Auckland’s GDP of $160bn in the year to March 2024 was 2.1 per cent higher (in real terms) than the previous year. The region remains the primary hub of the New Zealand economy, contributing 38 per cent to national GDP – a figure that is increasing over time.
Provisional estimates from Infometrics show that the region’s GDP declined to $158bn (-1.3%) in the year to March 2025. The decline across the rest of New Zealand was similar (-0.9%) and reflects the challenging short-term economic cycle the country has found itself in.
Apart from the first year of the pandemic, this would be the first decline in Auckland’s GDP since the GFC. In 2024, consumers were still feeling the effects of the Reserve Bank of New Zealand (RBNZ) increasing interest rates to curb inflationary pressures following the economic stimulus put in place by the Labour-led Government during the pandemic years, as well as the increased price of imported goods. Higher interest rates have led to cautiousness in investment, while businesses have also felt the dampening effect of reduced consumer activity.
Auckland’s economy has shown considerable resilience in recent years and the macroeconomic outlook in 2025 looks more positive. That being said, the impending threat of an international trade war has led to lower GDP growth projections than a few months ago.
-
Auckland’s GDP in the year to March 2024 was $160bn. However, provisional data from Infometrics shows a 1.3% decline in GDP in the year to March 2025. The rest of New Zealand saw a similar decline (-0.9%).
The provisional figure of $158bn is still 12.1% higher than the 2019 value of $141bn (in real terms), reflecting compound annual growth of 1.9%.
Auckland currently contributes 38% to New Zealand’s GDP, significantly higher than Auckland’s share of the population (34%), and more than double the contribution of Wellington, the next largest region.
-
Auckland’s GDP grew by 2.1% (in real terms) in the year to March 2024, while the rest of New Zealand’s only grew by 0.9% and Wellington’s GDP decreased 0.3% in real terms.
Only the West Coast and Otago regions had higher GDP growth rates in the year to March 2024 (2.8% and 2.4% respectively).
The provisional estimates for GDP in the year to March 2025 show a 1.3% decline in Auckland, slightly higher than the rest of New Zealand (-0.9%).
Auckland’s contribution to New Zealand’s GDP continues to increase - from 34% at the end of GFC in 2010 to 38% in 2024.
Aside from the first year of the pandemic (-1.2%), the provisional decline in GDP of 1.3% in the year to March 2025 is the first year growth has been negative since the GFC (YE March 2009: -2.2%)
Source: Stats NZ: Regional GDP – RNA. Infometrics: Regional Economic Profile
What’s driving economic performance?
% share of GDP by industry (2024)

Real GDP growth rate by industry (2024)
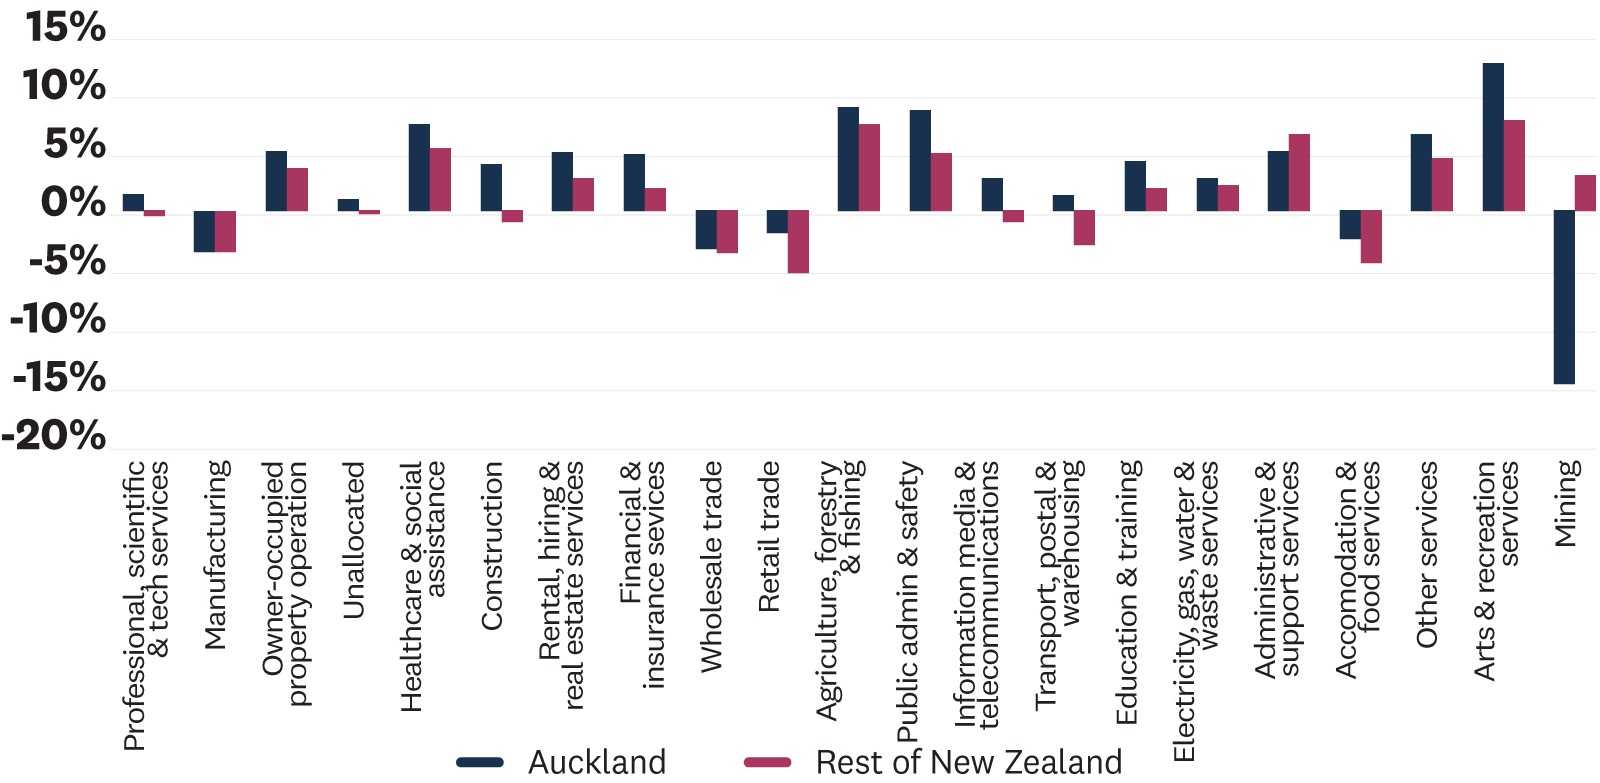
Tāmaki Makaurau Auckland's growth in the year to March 2024 was driven by a number of industries, with growth rates exceeding those of the rest of New Zealand for most industries.
Auckland’s economy is well-diversified, more than any other area of New Zealand - a key reason for its relative resilience. GDP growth in the year to March 2024 was driven by multiple industries, with noticeably stronger performance in ‘construction’, ‘transport and logistics’, ‘information media and telecommunications’, ‘financial and insurance services’, ‘public administration’ and ‘arts and recreation services’.
Auckland’s continued specialisation in high-value services relative to the rest of New Zealand provides a strong platform for future growth. Auckland’s city centre, the country’s commercial hub, has a particularly strong concentration of these services (see deep dive in section 3).
-
Auckland’s largest industries by GDP (ANZSIC Level 1) remain ‘professional, scientific and technical services’ and ‘financial and insurance services’, contributing a combined $33bn in GDP in the year to March 2024.
Industries providing high-value services accounted for 36% of Auckland’s GDP in the year to March 2024, compared to 26% for the rest of New Zealand. This figure is even higher in Auckland’s city centre (49%).
Primary industries contribute very little to Auckland’s economy (0.3% of GDP), compared to the rest of New Zealand (9%).
Auckland’s economy is well diversified. The largest industry (‘professional, scientific and technical services’) contributes 11% of Auckland’s GDP. Across the other 66 territorial authorities, the average GDP contribution for the largest industries is 20%.
-
The three industries which contributed the most to Auckland’s GDP growth in absolute terms, in the year to March 2024, were ‘financial and insurance services’ (+$600m), ‘healthcare and social assistance’ (+$590m) and ‘rental, hiring and real estate services’ (+$480m).
Auckland’s largest industry, ‘professional, scientific and technical services’, saw more subdued growth of 0.9%.
‘Construction’ continued its post-pandemic recovery, with growth of 3.5% in the year to March 2024. ‘Arts and recreation services’ also experienced strong growth (11.7%).
Two of Auckland’s largest industries experienced reductions in GDP (in real terms).
The ‘manufacturing’ industry experienced the largest absolute decline, with GDP dropping by $446.3 million (3.6%).
Similarly, ‘wholesale trade’—Auckland’s fourth-largest industry by GDP experienced a decline of 3.5% ($410.2 million).
Source: Infometrics: Regional Economic Profile
Real GDP per capita
Real GDP per capita (March year, 2024 Prices)

Tāmaki Makaurau Auckland’s economy generates GDP per capita of $89,000. Real GDP per capita decreased in the year to March 2024, and is likely to have done so in the year to March 2025 as well.
When spread over Auckland’s population, the $160bn GDP generated in the year to March 2024 represents $89,000 per person.
Real GDP per capita fell 0.3 per cent in the year to March 2024. Given continued population growth and provisional GDP growth of -1.3 per cent for the year to March 2025, it has almost certainly fallen again over the last 12 months as well - using the 2024 population estimate, the current figure would be $88,000. GDP per capita is often considered a proxy for the average standing of living, thus implying it has worsened over the last 24 months.
The rest of New Zealand has seen a similar decline in real GDP, though slightly smaller. This is noteworthy, as Auckland's GDP per capita has consistently grown at a faster rate than the rest of the country since the GFC.
-
Auckland’s GDP per capita in the year to March 2024 ($89,000) was 20% higher than the rest of New Zealand ($74,000).
This gap is effectively the same as in 2023 but has grown over time.
Wellington’s GDP per capita ($100,500) is 13% higher than Auckland’s. It is the only New Zealand region with a higher GDP per capita than Auckland, which is predominantly driven by a stronger concentration of service jobs in public administration (central government) and related professional business services.
Real GDP per capita in Auckland declined by 0.3% in the year to March 2024.
This is a slightly smaller reduction than the rest of New Zealand (-0.4%) and Wellington (-0.9%).
Provisional GDP estimates for the year to March 2025 and ongoing population growth would suggest a further reduction in GDP per capita of at least 1.3%.
Sources: Real GDP growth, real GDP per capita, inputs for Auckland GDP index – Infometrics: Regional Economic Profile
Auckland Economic Monitor
A summary of key economic information about the region
Auckland’s economy
-
![Economic activity]()
Economic activity
While Tāmaki Makaurau Auckland’s economy continued to grow in the year to March 2024, provisional estimates show a slight decline in economic output over the last 12 months.
-
![Businesses]()
Businesses
GDP output per worker (labour productivity) in Tāmaki Makaurau Auckland fell (in real terms) -0.7 per cent in the year to March 2024 and has likely stagnated or declined slightly in the year to March 2025.
-
![The labour market]()
The labour market
Tāmaki Makaurau Auckland’s workforce is growing, and continues to become more diverse and skilled.
-
![Economic confidence]()
Economic confidence
Tāmaki Makaurau Auckland's consumer confidence has fluctuated over the last 12 months, as part of a complex - yet promising - trend in sentiment.
-
![Visitor economy]()
Visitor economy
Tāmaki Makaurau Auckland offers the first taste of New Zealand for many international visitors. International tourism has recovered strongly, but it is not yet back to pre-COVID-19 levels.
-
![Community]()
Community
Tāmaki Makaurau Auckland is a young, diverse and growing region. It is home to 34 per cent of New Zealand’s population.
-
![]()
Emissions
Tāmaki Makaurau Auckland's ongoing efforts to manage and reduce emissions are part of its commitment to a greener and more sustainable future.